📌 Authored by: Pankaj Kumar | StockResults.in
📅 Posted on: May 14, 2025
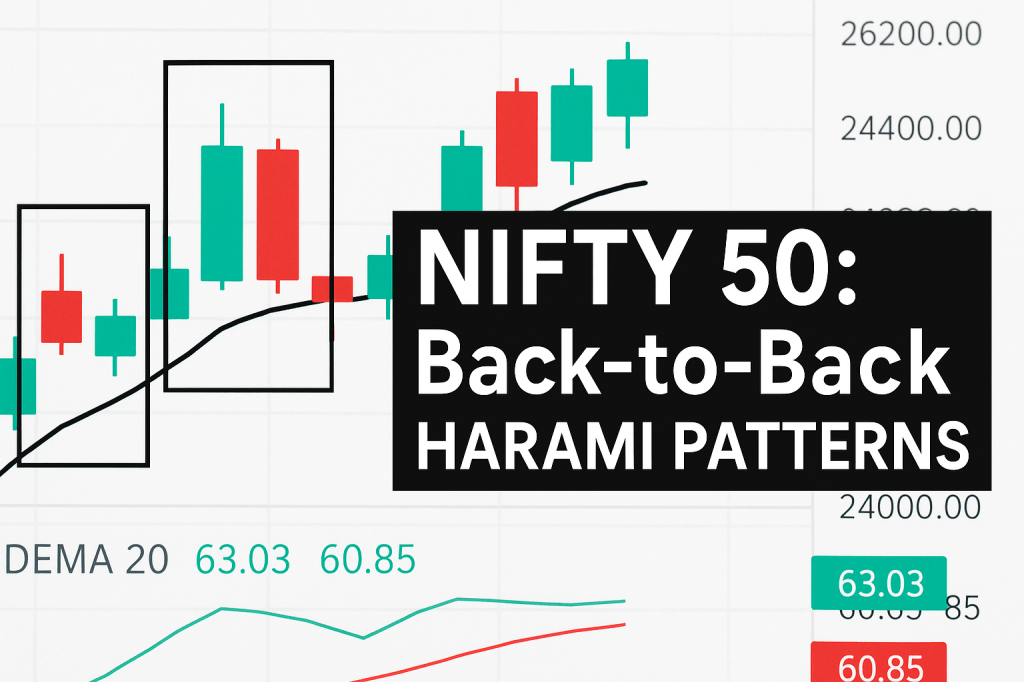
In a technically fascinating development, the NIFTY 50 index has displayed two consecutive Harami candlestick formations over the past three trading sessions. This pattern sequence is rare and emphasizes a clear tug-of-war between bulls and bears.
Here’s a breakdown of what this means and how you can prepare for the potential move ahead.
📊 May 10–13: First Signal – Bearish Harami
- On May 10, the index recorded a strong green candle, suggesting strong upward momentum.
- On May 13, the candle that followed was red and significantly smaller, fitting completely inside the prior day’s range.
- This combination resembles a Bearish Harami, often interpreted as a warning that upward momentum may be stalling.
- However, there was no continuation or downside confirmation the next session.
📉 Interpretation: A potential pause or shift in bullish sentiment, but the lack of follow-through weakens the signal.
📈 May 13–14: Second Signal – Bullish Harami
- On May 13, a dominant red candle reflected intraday selling pressure.
- The session on May 14 reversed slightly with a small green candle forming entirely within the body of the red candle.
- This is characteristic of a Bullish Harami, often seen as a potential turning point for buyers to re-enter.
📈 Interpretation: A possible shift back to bullish bias, but confirmation is still essential before acting.
🔄 Why This Dual Setup Matters
The back-to-back Harami setup indicates a high degree of uncertainty in the market. In simpler terms:
✅ Buyers are hesitant to push higher after recent gains
✅ Sellers are unable to follow through on bearish setups
🔄 The market is currently balancing itself, preparing for a breakout once direction is confirmed.
📍 Technical Levels to Keep an Eye On:
| Type of Level | Price Area |
|---|---|
| Short-Term Floor | ₹24,550 |
| Dynamic Support (20-EMA) | ₹24,630 |
| Recent Swing Peak | ₹24,864 |
| Psychological Resistance | ₹25,000 |
📉 Momentum Indicator:
- Relative Strength Index (14-Day): 63.03
This reading points to a stable but cautious bullish sentiment. There is no sign of overbought or oversold pressure at the moment.
🔮 What to Expect on May 15, 2025:
| Outlook | Price Action Confirmation Needed |
|---|---|
| 🔼 Upside Move | Break and close above ₹24,864 |
| 🔽 Downward Shift | Drop below ₹24,550 |
🚨 Important Note: Harami patterns alone do not guarantee direction. Traders should wait for price validation before making decisions.
🧠 Final Takeaway:
The NIFTY 50 is exhibiting a classic sign of price compression. With conflicting candlestick signals, the index appears to be gathering momentum for its next significant move. Traders should watch the upcoming sessions closely, especially for a break above ₹24,864 or a drop below ₹24,550 to confirm direction.
Disclaimer: This information is for educational purposes only and should not be considered investment advice. Please do your own research before making any financial decisions.
